The Analytics section is your platform’s dashboard. It’s built around one practical question
every operator has at launch: how many real humans are here versus bots — so I know when I can safely dial
the bots down? As your real player base grows, Analytics shows you exactly that, alongside signups,
retention and your most active players.
It works out of the box — no setup — and the live view refreshes automatically every 15 seconds. The page has
three zones.
1. Live pulse — what’s happening right now
A real-time snapshot of activity this moment:
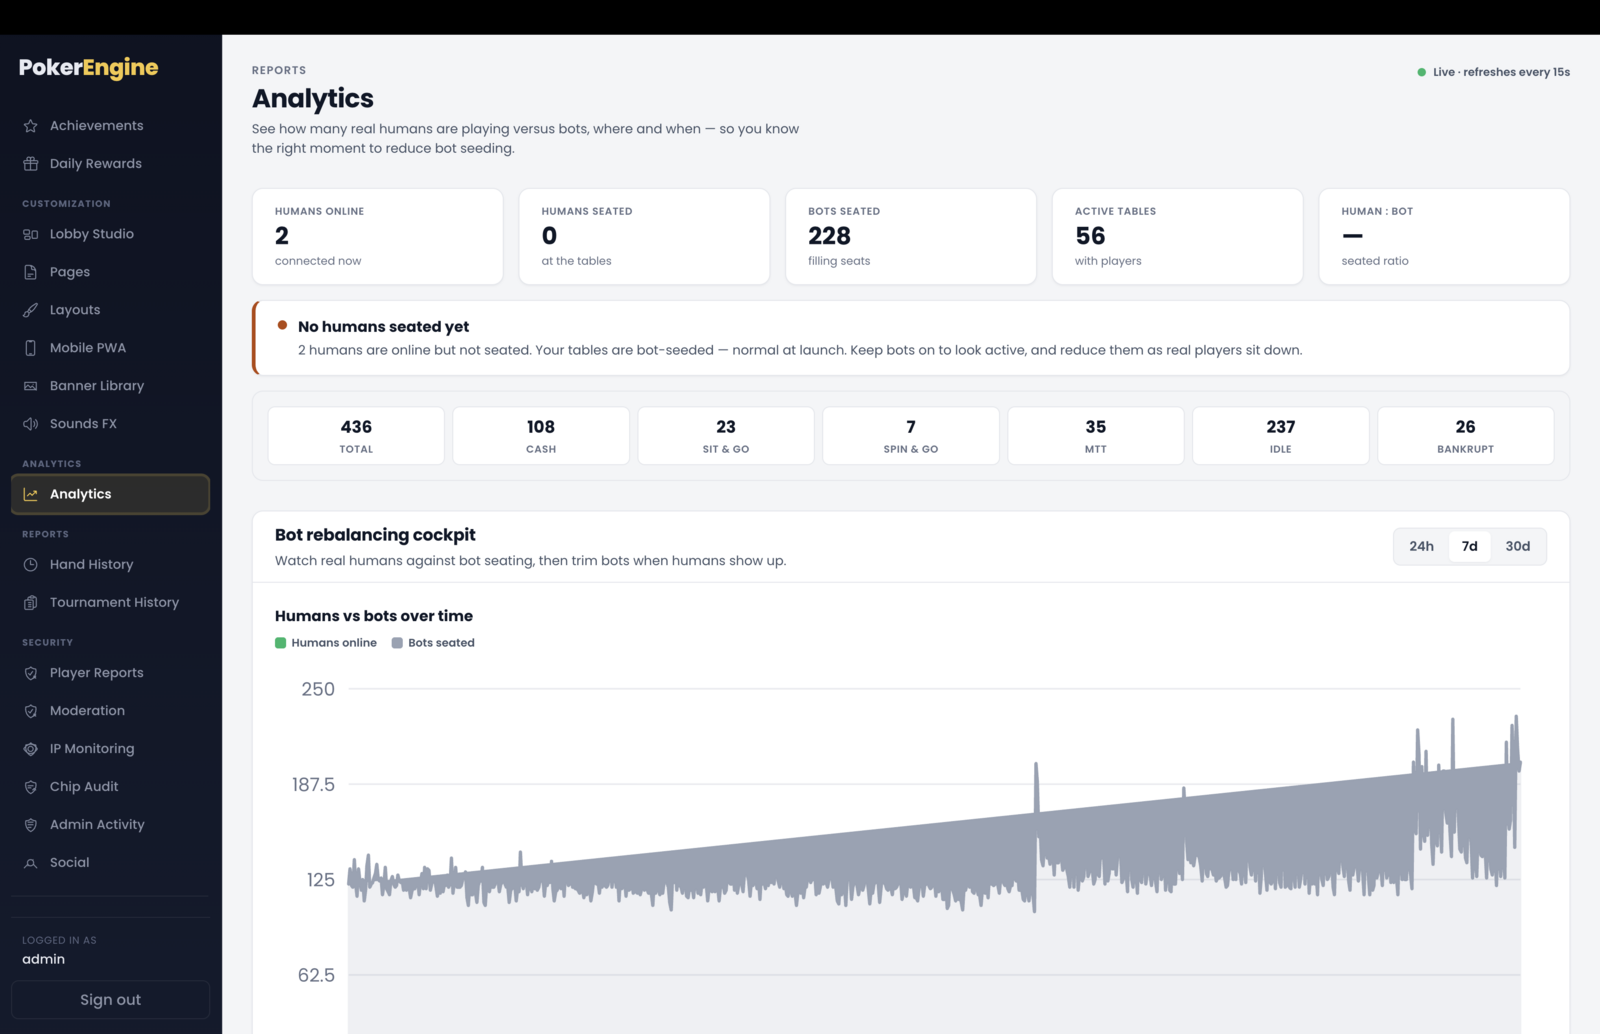
Humans online — real players connected right now.
Humans seated and Bots seated — how many of each are sitting at tables, plus the human-to-bot ratio.
Bot breakdown — where your bots are deployed: cash tables, Sit & Go, Spin & Go, MTT, plus idle and bankrupt.
A plain-language recommendation — a banner that reads the situation and advises, e.g. “No humans seated yet”, “Humans are arriving”, or “Healthy human activity — you can safely dial bots down.” This is your cue for managing the bot pool.
Live pulse — the real-time human-vs-bot snapshot, with a recommendation banner and the bot breakdown.
2. Trends — humans vs bots over time
The history that helps you spot patterns:
Humans vs bots over time — a chart tracking real humans online against bots seated, over 24 hours, 7 days or 30 days.
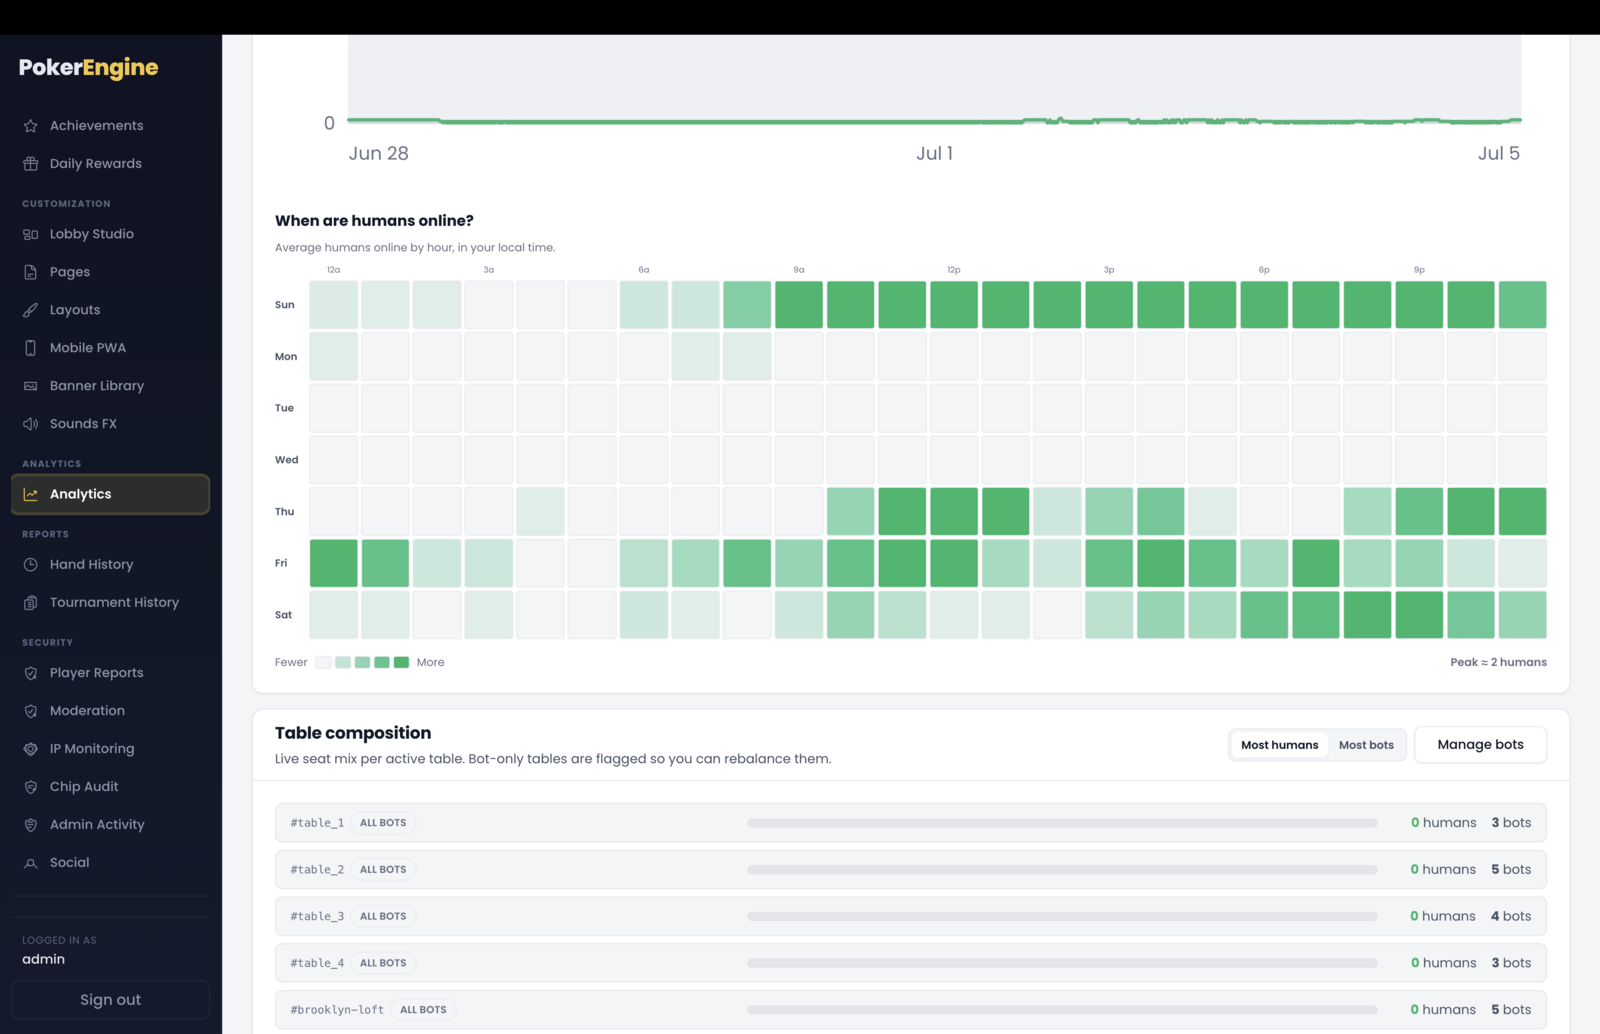
“When are humans online?” heatmap — a 7-day × 24-hour grid showing when your real players tend to be active (in your local time), so you can time promotions and see your peak hours.
Table composition — a live list of your tables sorted by how many humans (or bots) are at each, with a quick link to manage bots.
Trends — the humans-vs-bots curve, the local-time activity heatmap, and live table composition.
3. Real players — your human audience (bots excluded)
This zone is humans only — bots are filtered out completely, so these numbers reflect your real
business:
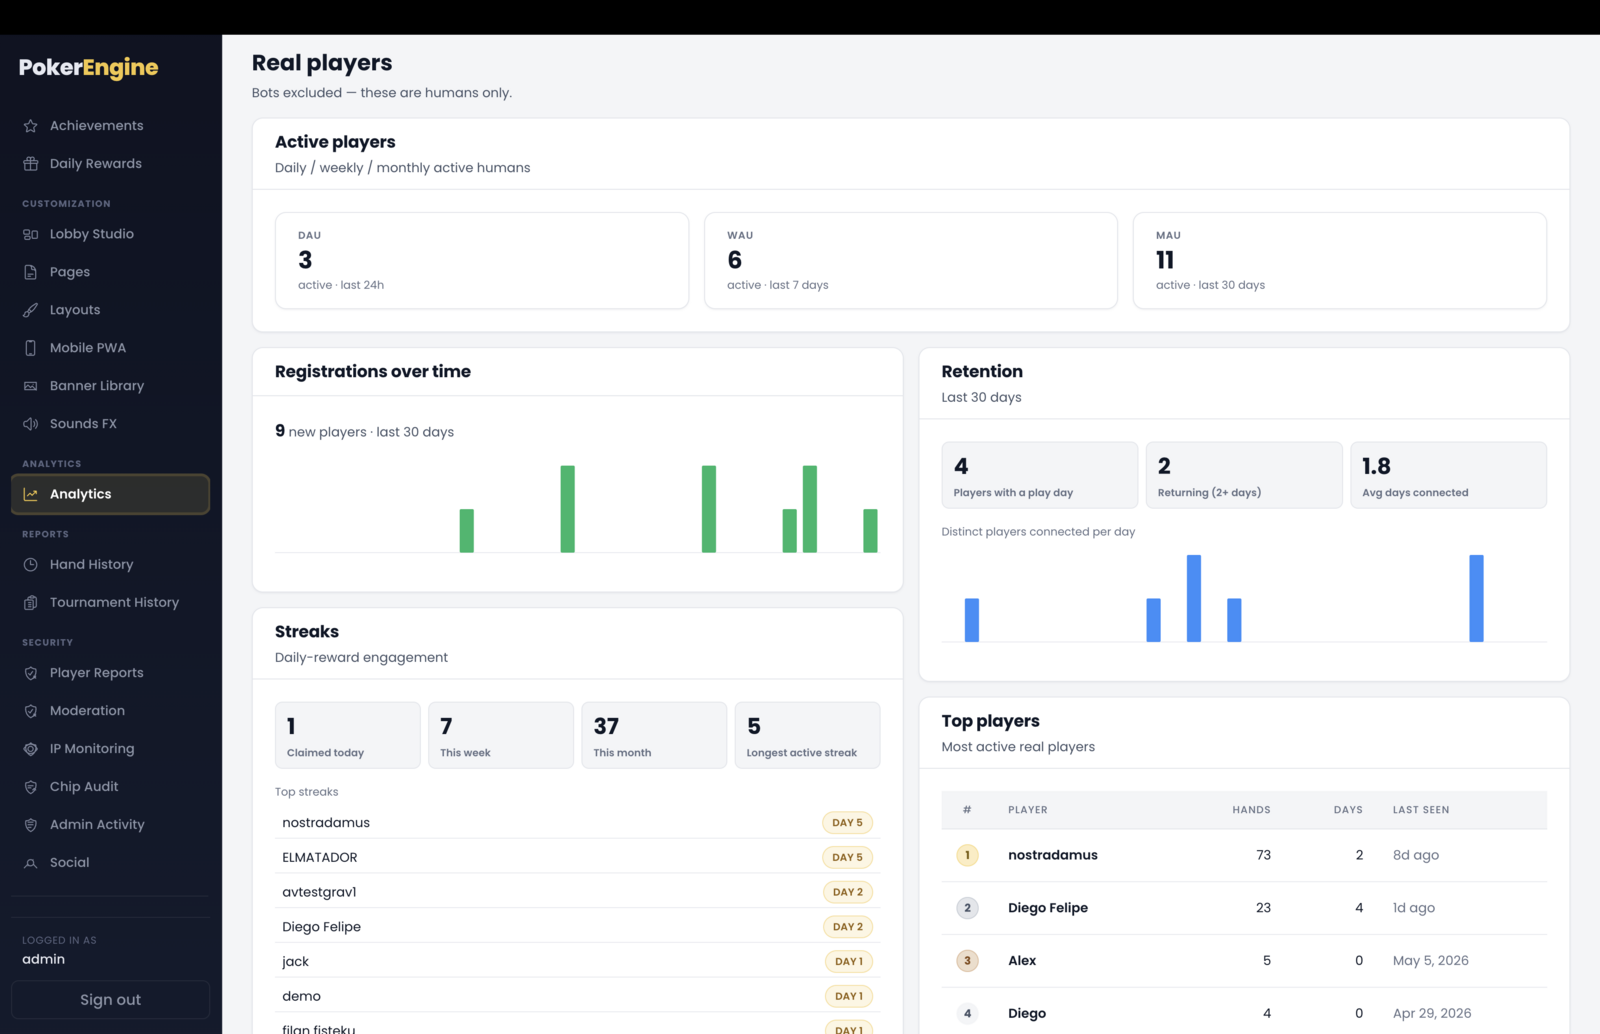
Active players — DAU / WAU / MAU (distinct real players active in the last day, week and month).
New registrations — signups over time, with a per-day bar chart.
Retention — how many players came back on two or more days, the average number of days played, and a per-day “connected players” chart.
Daily-reward streaks — claims today / this week / this month, the longest active streak, and your top streakers.
Top players — your most active real players by hands played.
Real players — humans only: DAU/WAU/MAU, registrations, retention, streaks and your top players.
Good to know
Bots are shown on purpose — but only in zones 1 and 2. The whole point of those zones is the human-vs-bot picture. Zone 3 excludes bots entirely, so a busy-looking lobby with a near-zero DAU simply means your tables are bot-seeded — completely normal at launch.
“Online” means connected right now (live), while “active” (DAU/WAU/MAU) counts distinct players seen within a rolling window.
Live pulse and player stats are real-time; the trend charts are built from periodic snapshots (about every 12 minutes), so brand-new activity appears on the curves shortly after, not instantly. On a fresh install the trend charts fill in once there’s a little history.
Most date breakdowns use UTC; the activity heatmap is shown in your own local time (it’s labeled as such).
Use it to manage your bots. Watch the human numbers climb, and when real activity is healthy at your peak hours, reduce your bot counts (in the Bots sections) so real players increasingly play each other.